More updates are in progress. Coming Soon!!
More dashboards
For more information about the dashboard projects and process, and to view dashboards for specific regions in Texas, please visit the project website.
About the data
Real-time data is messy and we see the ramifications of this in a few of our graphs. The interpretations of this data should be considered in light of several limitations. Briefly,
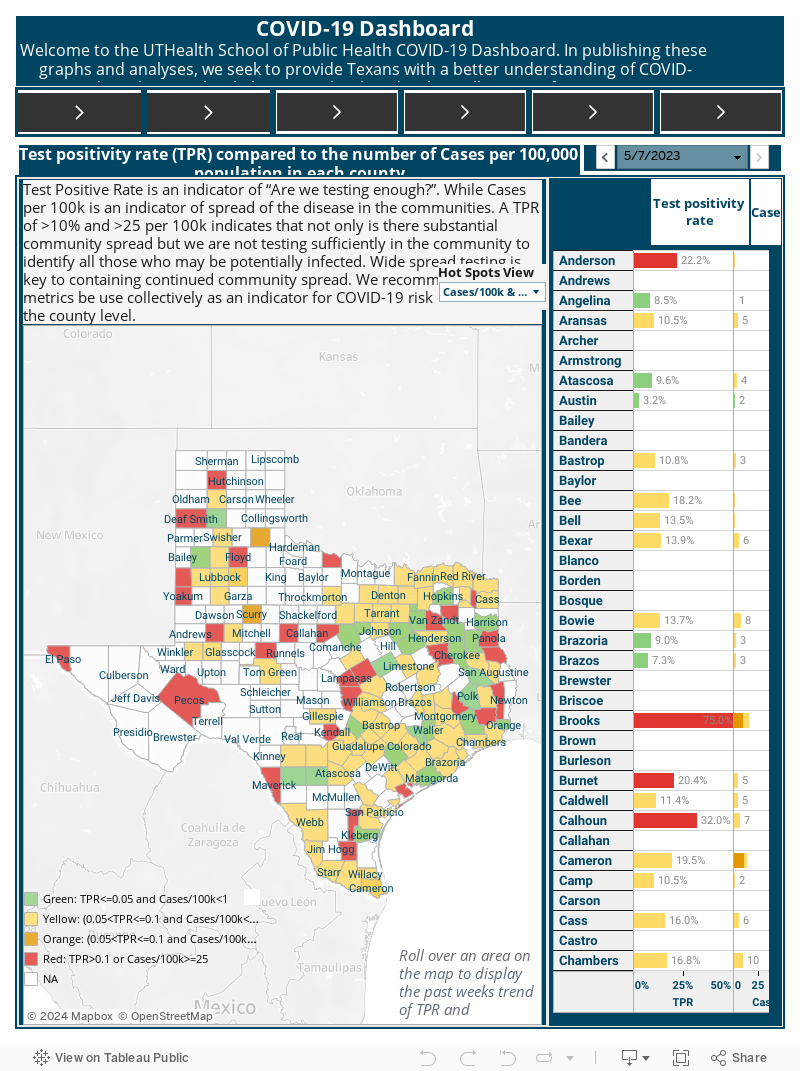
- Data source: Texas Department of State Health Services.
- Day-to-day data at the state-level (which we are displaying) will be different than county-level dashboards. This is due to the reporting lag from the county to the state.
- Testing and cases data are underestimated. This is because not all clinics are reporting data in a comprehensive, systematic manner. As time moves on, this data gets more and more accurate to reflect the "true" burden in Texas.
- Positive COVID19 cases after May 19 do NOT include antibody tests.
- There are data dumps for smaller counties. A "data dump" is a large amount of cases counted on one date instead of spread over time. We probably see this, for example, in Anderson county on June 17. This impacts projection, hot spots, and R(t) analyses. Interpret cautiously.
- There are some situations where the daily cases are negative. This may be due to retrospective county corrections. The models “smooth” the data to account for these outliers, but larger outliers may still have significant influence on analyses.
- On March 24, 2020, all hospitals were mandated to report COVID19 hospitalizations to the state. To systemize reporting, the Hospital Preparedness Program Providers (HPP) created 8 subgroups across Texas in charge of collecting hospital data and reporting to the state. To keep reporting consistent throughout the state, DSHS defined key metrics. Briefly,
- COVID19 hospitalization: confirmed PCR or suspected COVID19.
- Suspected COVID19: 1) patient with respiratory illness AND no other obvious causes AND no travel within 14 days; 2) respiratory illness AND has been in contact with a confirmed COVID19 person; 3) severe respiratory illness AND requires hospitalization AND no other obvious explanation.
- Bed availability: Defined as including hospital bed, ICU beds and surge bed availability as reported by the hospitals to the state. Hospital, ICU, or surge bed availability must only be reported to the state if they are staffed.
- Ventilator availability: Total number of adult ventilators available, to include adult ventilators that are capable of ventilating a pediatric patient. Any device used to support, assist or control respiration through the application of positive pressure to the airway when delivered via an artificial airway.
Hospitals, cities and counties may adjust the availability of hospital beds as cases increase or decrease within their jurisdictions.
Details of the statistical modeling
R(t) was estimated using the R0 package in R. The generation time estimates were generated using a gamma distribution with mean 3.96 and standard deviation 4.75, based on estimates from Ganyani, et al. 2020. We investigated several options based on the literature and found this choice of distribution and parameters to not affect the results significantly. Some of the R(t) estimates may be unreliable for counties with “data dumps”. Interpret cautiously for these counties as we are not able to observe the trend over time. To smooth the data, we used 7-day moving averages in the R(t) estimation. Case reports are lagged from test administration (at the beginning the lag was closer to 2-3 weeks and by May it was closer to 2-5 days), thus what we currently are able to estimate is a reflection of tests performed several days prior. This lag may differ by county, hospital, and testing center. R(t) is only estimated for counties who have had at least 50 total cases.
Ganyani T, Kremer C, Chen D, Torneri A, Faes C, Wallinga J, Hens N. Estimating the generation interval for coronavirus disease (COVID-19) based on symptom onset data, March 2020. Eurosurveillance. 2020 Apr 30;25(17):2000257.
To build the predictions of new cases, an Auto regressive Integrated Moving Average (ARIMA) model was built on 7-day moving averages of new cases to predict 10-days in the future. The order of autoregression, degree of differencing, and moving average for the model was selected using the auto.arima function in R, selecting the best model based on the Aikake Information Criteria. If the number of max daily cases was too low, no estimates were produced. The limitations of these projections include: (1) these projections are built purely on previous data trends and do not account for any covariates at this time; (2) predictions may be unreliable for counties that have data dumps; (3) case reports are lagged from test administration (at the beginning the lag was closer to 2-3 weeks and by May it was closer to 2-5 days), thus what we currently are able to estimate is a reflection of tests performed several days prior. This lag may differ by county, hospital, and testing center.
UTHealth School of Public Health team
Faculty:
Ashraf Yaseen, PhD, Assistant Professor of Data Science
Jose-Miguel Yamal, PhD, Associate Professor of Biostatistics and Data Science
Shreela Sharma, PhD, Professor of Epidemiology
Katelyn Jetelina, PhD, Assistant Professor of Epidemiology
Bijal Bala, PhD, Associate Professor of Epidemiology
Nalini Ranjit, PhD, Associate Professor of Health Promotion and Behavioral Sciences
Alanna Morrison, PhD, Professor and Chair, Department of Epidemiology, Human Genetics and Environmental Sciences
Staff:
Michael Gonzalez
Rachel Atterstrom
Students:
Jeffrey Brennan
Alison Rector
Tara Prezioso
Hongyin Lai
Swaminathan Kumar
Sungjin (Elin) Cho
Yuan Li
Qin Wang
Mira Jain
Rachit Sabharwal
Support for the dashboard has been generously provided by the Department of Epidemiology, Human Genetics and Environmental Sciences. Faculty have appointments in both the Biostatistics and Data Science Department and Department of Epidemiology, Human Genetics and Environmental Sciences at the University of Texas Health Science Center, School of Public Health.